The Black Box of .NET Headline Animator

Showing posts with label visual studio. Show all posts

January 14, 2025

.NET 9.0 Debugging Issue - F10 Step Over executes multiple steps

I recently ran into a debugging issue with my latest VisualStudio 2022 update and Resharper C# installation. It's important to note that I didn't start using this setup until I'd upgraded my projects to .NET 9.0.

I was able to hit breakpoints but found that while stepping over statements (F10), the debugger would sometimes run to the next breakpoint, execute a random number of steps forward to a different line in the call stack, or run to completion. The issue was intermittent too. Ugh. I also use a number of VisualStudio extensions so that didn't make it any easier to find the cause. I ended up trying the following to no avail:
  1. disabling Resharper's Async Typing and Debugger Integration. I'd seen some race conditions with the Async Typing and since the debugging issue was intermittent I figured I'd try disabling Async Typing even though it didn't have any apparent connection to the debugger. 
  2. disabling all extensions 
  3. uninstalling all extensions 
  4. repairing the VisualStudio installation
Once I was down to a bare bones VisualStudio installation I figured it was VisualStudio itself. By this time I didn't want to continue debugging by deduction any longer so I didn't want to go down the road of rolling back to previous VisualStudio versions. I went on to the Feedback Forum for VisualStudio to look for an existing bug and open one if I couldn't find one there. I came upon this issue in the Developer Forum: Debugger randomly stepping over user code. It never occurred to me that I was now using .NET 9 and the problem could've been related. ðŸ¤¯

I ultimately found the following issues opened for the .NET 9.0 runtime which all had the same root cause:
  • Debugging Issue VS 2022 .net 9 #110841
  • Step becomes a "go" in .NET 9 #109785
  • foreach will jump to other code in dotnet9 #109812
  • Step Over sometimes executes a lot more than one statement #109885
  • And the fix merged here: #110533
The fix was pretty small and there were only two files changed:

The Controller in the CoreClr's Debugger Execution Engine:

And the Thread Suspension class:


Ironically, as I was writing this post I got an email about .NET 9.0.1 being released. I couldn't find any of the issues or the PR for the fix included in the Release Notes. I went back to the Fix a step that becomes a go #110533 PR notes and saw that the Milestone for the fix is 9.0.2 (release date TBD). I was disappointed to find that the fix was not included in the .NET 9.0.1 Release but happy that it is coming in the next release of 9.0.2.


Share

April 19, 2019

Missing Start Page from Visual Studio 2019

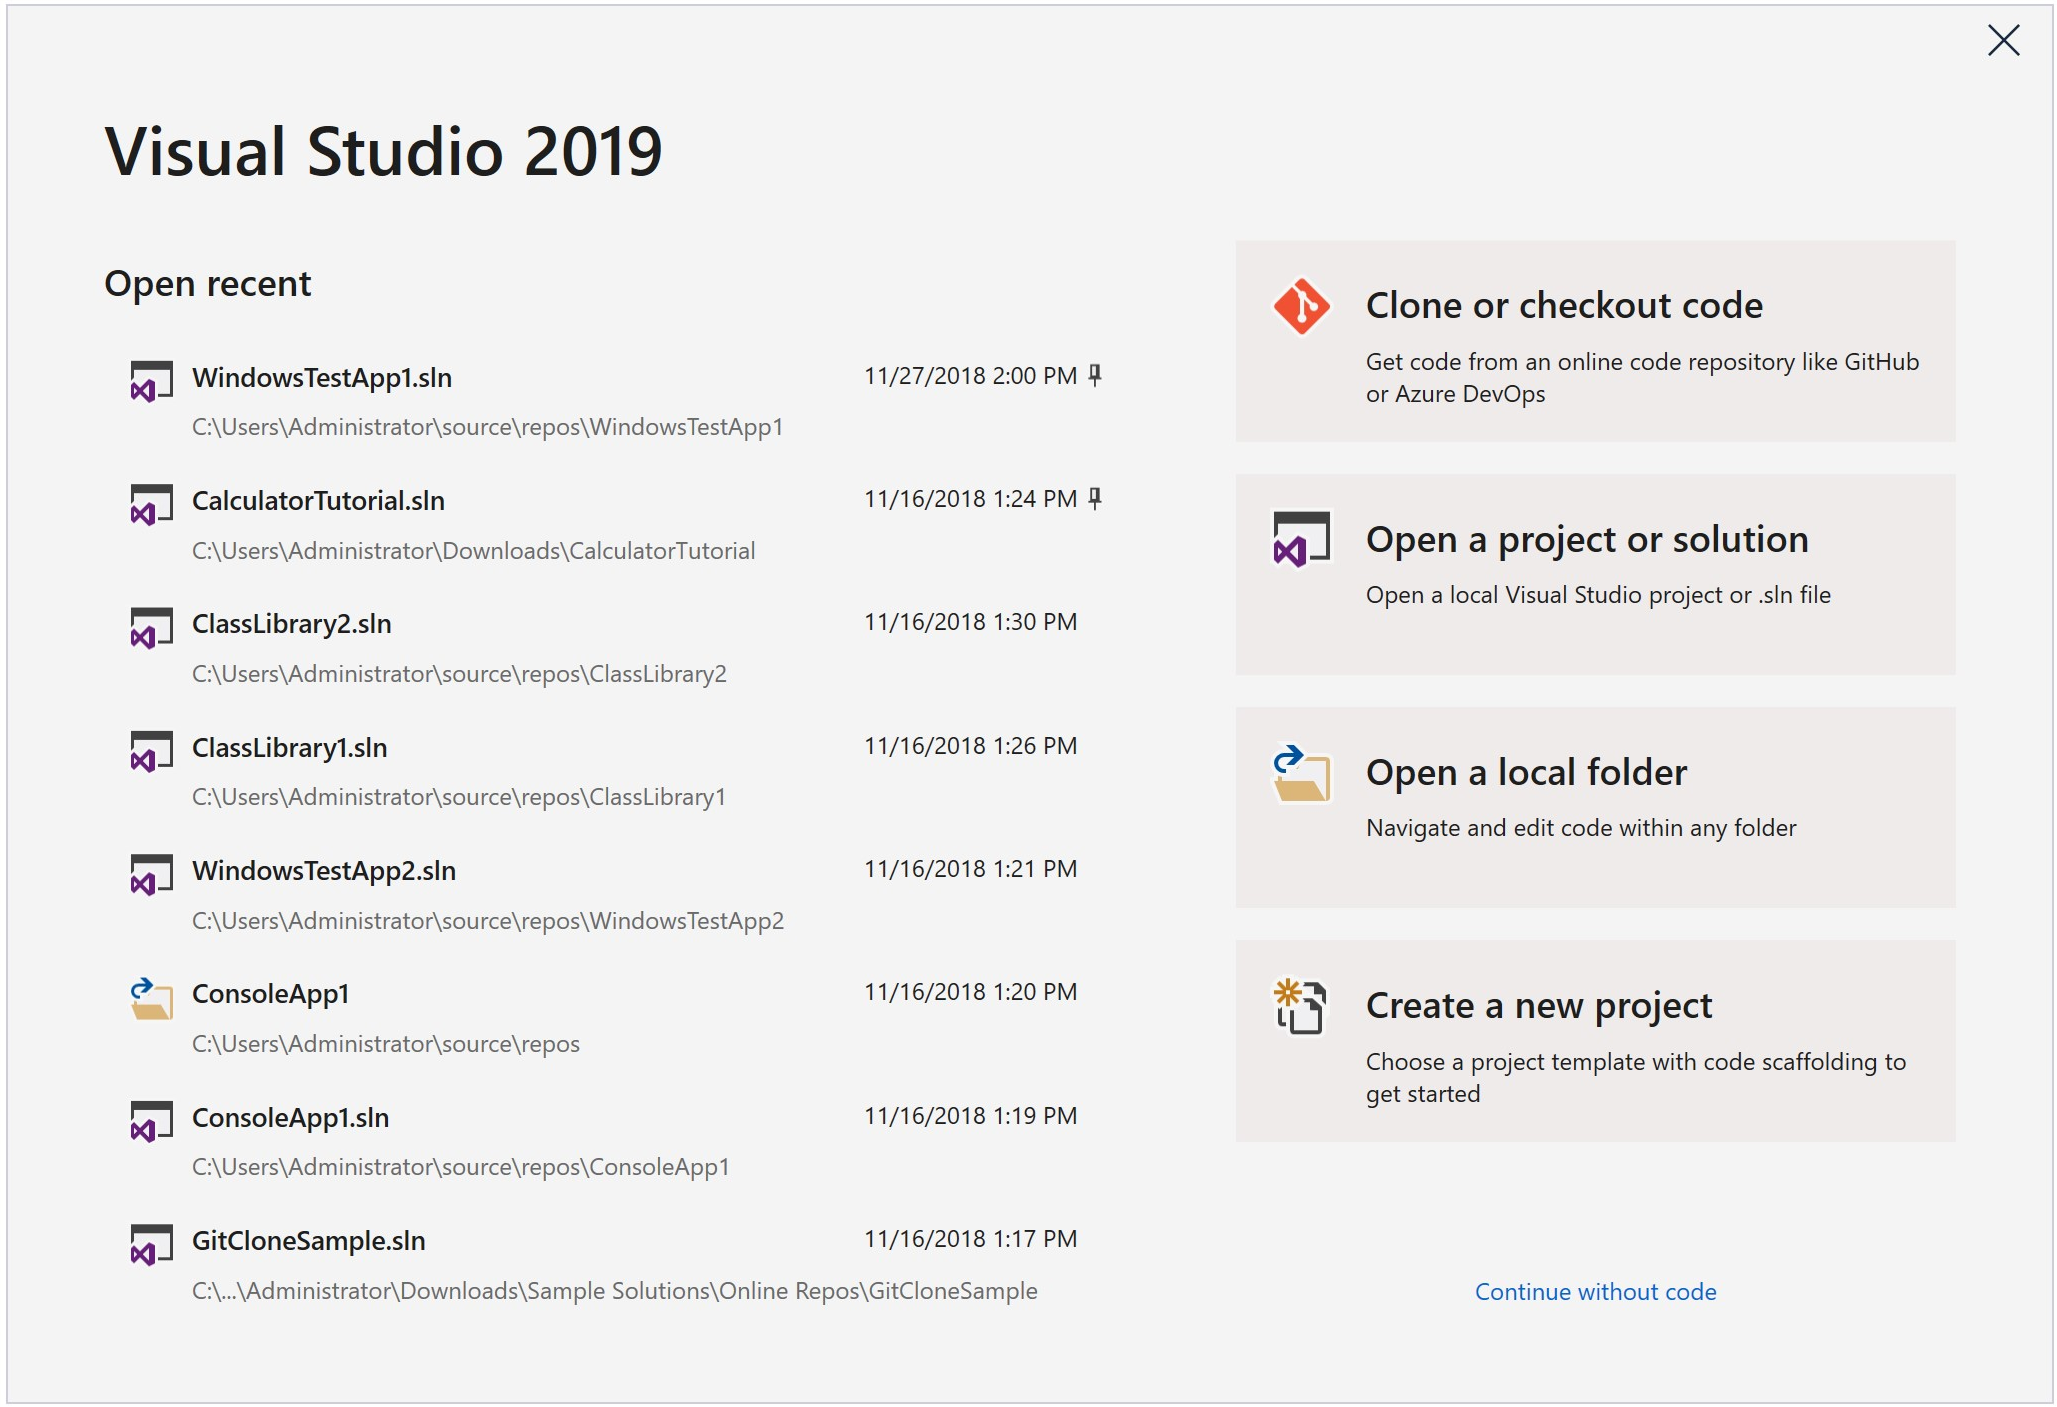
Oh Microsoft, why hast thou forsaken the beloved 'Start Page' and replaced it with a modal window?

The new 'Start Window' which replaces the 'Start Page'

You can see the design reasoning behind the new VS 2019 Start Window as posted at 'Get to code: How we designed the new Visual Studio start window' and 'New Start Window and New Project Dialog Experience in Visual Studio 2019'.

I sincerely appreciate any amount of thought, consideration, or testing that a company decides to invest in their products - especially a flagship produce like Visual Studio.  Based on the design reasoning Microsoft certainly had good intentions and did put a good amount of thought and testing into the effort.  However, I think they missed the mark.  Perform any Google search on "missing start page visual studio 2019" or look on the Developer Community Feedback Site and you'll see devs crying out for the beloved Start Page.

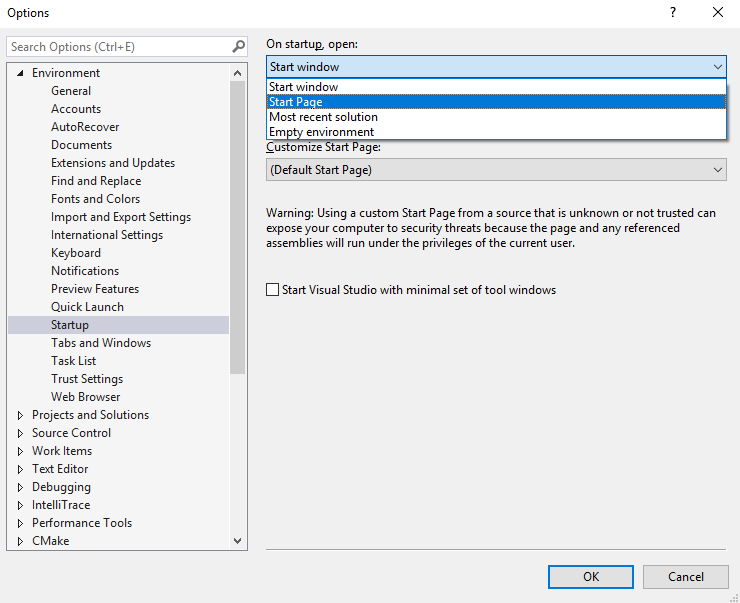
Some things are better left untouched and left alone and the Start Page is one of them. Some might argue the new 'Start Window' is a better experience but why make it a modal window?  Really?  In Visual Studio 2019 Preview 1, at least the option to restore the 'Start Page' was available as an option in the Startup settings:


However, somewhere along the way the 'Start Page' item has disappeared from the drop-down...headsmack!  Here's what the options are in version 16.0.2:


Ok, now I'm getting frustrated.  I get it. You're trying to funnel me into this new window that you think is better.  Well, my response is


Fortunately, Microsoft hasn't completely done away with the 'Start Page'...yet.  You can still add it by customizing the toolbar to add the Start Page button:

1. Right-click the toolbar and select 'Customize':

2. Select the 'Commands' tab:

3. Select 'Toolbar' and change the dropdown to whatever menu you'd like, then click the 'Add Command' button:
4. Choose 'File' from the Categories list box, then select 'Start Page' from the Commands list box:

So, there you go!  At least it's still there for now.  I'd bet any amount of money that they change the experience back so that either the 'Start Page' option is available from the Environment/Startup setting. To be fair, Microsoft has improved significantly at listening to community feedback.
Share

February 1, 2011

Referencing platform-specific (x86/x64) assemblies in Visual Studio projects

CodeProjectRecently I've been thinking about how to make Assembly References dependent on the Platform Architecture for a given compiled application/library. A solution for this problem is necessary as you begin to move your apps to the x64 platform.

There are 2 solutions: one method is for "project-references"; the other is for "path-hardcoded dll references". Unfortunately, both involve manually editing the .csproj file yuk... AFAIK, there is no way to do this within the VisualStudio 2008 UI - I don't know about VS 2010. Note that it is NOT necessary to modify any of the references to the .NET dlls.

One quick note about these solutions is that they are independent of the Platform Architecture of the machine that is compiling the projects!

After opening the .csproj file in a text-editor (or as a .xml file within VisualStudio), do either of the following depending on your needs. Note that valid platform values are either: x86, x64, or ia64.

Platform-Specific Project References:

<ProjectReference Include="..\SomeLibrary.csproj" Condition="'$(Platform)' == 'x64'">
    <Project>{GUID of existing proj ref goes here...}</Project>
    <Name>SomeLibrary</Name>
</ProjectReference>


Platform-Specific Binary (.dll) References:

<Reference Include="SomeDll, Version=..., Culture=..., PublicKeyToken=..., processorArchitecture=x86" Condition="'$(Platform)' == 'x86'" />
    <SpecificVersion>False</SpecificVersion>
    <HintPath>C:\MyAppReferences\x86\SomeLibrary.dll</HintPath>
</Reference>

<Reference Include="SomeDll, Version=..., Culture=..., PublicKeyToken=..., processorArchitecture=x64" Condition="'$(Platform)' == 'x64'" />
    <SpecificVersion>False</SpecificVersion>
    <HintPath>C:\MyAppReferences\x64\SomeLibrary.dll</HintPath>
</Reference>


Share

January 26, 2011

Want to have "WinDbg and SOS-like" features in VisualStudio?

While I've become adept at using WinDbg and all of it's extensions to do post-mortem crash-dump analysis, I've not yet ventured down the path of live-debugging strictly with WinDbg.  Maybe I'm dense, but it's anything but intuitive to me.  Call me "new-school" but there's just something about having a real UI while debugging that makes me more productive.

So, if you've ever needed to use some functionality of WinDbg or SOS (and any of the other extensions) while debugging in VisualStudio, there is some hope...

I've added 2 feature suggestions on the Microsoft Connect website for two features:
  1. View an object's rooted references at runtime - https://connect.microsoft.com/VisualStudio/feedback/details/637376/add-feature-to-debugger-to-view-an-objects-rooted-references
  2. View an object's memory footprint/usage - https://connect.microsoft.com/VisualStudio/feedback/details/637373/add-feature-to-debugger-to-view-an-objects-memory-footprint-usage
If either of these are something you'd like to see in an upcoming version of VisualStudio, please click the links above and vote for them!


As a side note, if you can't wait for the next version of VisualStudio, there are 2 different workarounds in the meantime:
  1. Load SOS into the Immediate Window as documented here:  http://msdn.microsoft.com/en-us/library/yy6d2sxs.aspx
  2. The other option is to stop at a breakpoint in VisualStudio, and then attach WinDbg in "non-invasive" mode.
While these workarounds seem to be mildly satisfactory, it'd be great if these features were already built in to the VS Debugger - so vote!


Share