The Black Box of .NET Headline Animator

February 1, 2025

Mocking HttpClient in Unit Tests

One of the patterns in writing good unit tests is to mock dependencies. This is important so that you only test the functionality within your class and isolate anything that a dependency might perform. This is especially important when your class accesses an external resource. For example, if I have a database or web api that my class depends on, not only do I not want to have a database CRUD operation, or data-mutating web api operation executed, but these resources will not be available during test execution. Acheiving this mocking is often facilitated by Dependency Injection (DI).

Given the following simplistic/contrived code, how can you mock the HttpClient dependency?

public class ClassUnderTest
{
    private readonly HttpClient _httpClient;
    private const string Url = "https://myurl";

    public ClassUnderTest(HttpClient httpClient)
    {
        _httpClient = httpClient;
    }

    public async Task<Person> GetPersonAsync(int id)
    {
        var response = await _httpClient.GetAsync($"{Url}?id={id}");
        return await response.Content.ReadFromJsonAsync<Person>();
    }
}

public class Person
{
    public int Id { get; set; }
    public string Name { get; set; }
    public int Age { get; set; }
}

First, let's consider one solution that, though possible, isn't the best. HttpClient does not implement an interface. You write your own interface like this:

public interface IHttpHandler
{
    HttpResponseMessage Get(string url);
    HttpResponseMessage Post(string url, HttpContent content);
    Task<HttpResponseMessage> GetAsync(string url);
    Task<HttpResponseMessage> PostAsync(string url, HttpContent content);
}
and add a class that implements it. The details of the implementation would be difficult to write in such a way that they are extensible and usable in various scenarios. Fortunately, there are already solutions out there that are freely available to you via Nuget Package. Let's walk thru a couple of Nuget Packages that I've done some POC's on using xUnit before deciding on a single solution (Moq.Contrib.HttpClient). Then I'll show examples of how you can use each. Note that there are many more abilities to each framework than what I show below; I kept each example succinct for clarity.

Moq (by itself)

This is relatively straightforward if you are familiar with using the Moq framework. The "trick" is to mock the HttpMessageHandler inside of the HttpClient - not the HttpClient itself. NOTE: It is good practice to use MockBehavior.Strict in the mock so that you are alerted to any calls that you have not explicitly mocked-out and were expecting.

Example:

[Fact]
public async Task JustMoq()
{
    //arrange
    const int personId = 1;
    var mockHandler = new Mock<HttpMessageHandler>(MockBehavior.Strict);
    var dto = new Person { Id = personId, Name = "Dave", Age = 42 };
    var mockResponse = new HttpResponseMessage
    {
        StatusCode = HttpStatusCode.OK,
        Content = JsonContent.Create<Person>(dto)
    };

    mockHandler
        .Protected()
        .Setup<Task<HttpResponseMessage>>(
            "SendAsync",
            ItExpr.Is<HttpRequestMessage>(m => m.Method == HttpMethod.Get),
            ItExpr.IsAny<CancellationToken>())
        .ReturnsAsync(mockResponse);

    // Inject the handler or client into your application code
    var httpClient = new HttpClient(mockHandler.Object);
    var sut = new ClassUnderTest(httpClient);

    //act
    var actual = await sut.GetPersonAsync(personId);

    //assert
    Assert.NotNull(actual);
    mockHandler.Protected().Verify(
        "SendAsync",
        Times.Exactly(1),
        ItExpr.Is<HttpRequestMessage>(m => m.Method == HttpMethod.Get),
        ItExpr.IsAny<CancellationToken>());
}


RichardSzalay.MockHttp

RichardSzalay.MockHttp is another popular solution. I've used this in the past but found it slightly more cumbersome that Moq.Contrib.HttpClient. There are two different patterns that can be used here. Richard describes when to use one vs the other here.

Example (using BackendDefinition pattern):

[Fact]
public async Task RichardSzalayMockHttpUsingBackendDefinition()
{
    //arrange
    const int personId = 1;
    using var mockHandler = new MockHttpMessageHandler();
    var dto = new Person { Id = personId, Name = "Dave", Age = 42 };
    var mockResponse = new HttpResponseMessage
    {
        StatusCode = HttpStatusCode.OK,
        Content = JsonContent.Create<Person>(dto)
    };

    var mockedRequest = mockHandler.When(HttpMethod.Get, "https://myurl?id=1")
        .Respond(mockResponse.StatusCode, mockResponse.Content);

    // Inject the handler or client into your application code
    var httpClient = mockHandler.ToHttpClient();
    var sut = new ClassUnderTest(httpClient);

    //act
    var actual = await sut.GetPersonAsync(personId);

    //assert
    Assert.NotNull(actual);
    Assert.Equivalent(dto, actual);
    Assert.Equal(1, mockHandler.GetMatchCount(mockedRequest));
    mockHandler.VerifyNoOutstandingRequest();
}

Example (using RequestExpectation pattern):

[Fact]
public async Task RichardSzalayMockHttpUsingRequestExpectation()
{
    //arrange
    const int personId = 1;
    using var mockHandler = new MockHttpMessageHandler();
    var dto = new Person { Id = personId, Name = "Dave", Age = 42 };
    var mockResponse = new HttpResponseMessage
    {
        StatusCode = HttpStatusCode.OK,
        Content = JsonContent.Create<Person>(dto)
    };

    var mockedRequest = mockHandler.Expect(HttpMethod.Get, "https://myurl")
        .WithExactQueryString($"id={personId}")
        .Respond(mockResponse.StatusCode, mockResponse.Content);

    // Inject the handler or client into your application code
    var httpClient = mockHandler.ToHttpClient();
    var sut = new ClassUnderTest(httpClient);

    //act
    var actual = await sut.GetPersonAsync(personId);

    //assert
    Assert.NotNull(actual);
    Assert.Equivalent(dto, actual);
    Assert.Equal(1, mockHandler.GetMatchCount(mockedRequest));
    mockHandler.VerifyNoOutstandingExpectation();
}


Moq.Contrib.HttpClient

Like the solution for using Moq by itself, this is straightforward if you are familiar with using the Moq framework. I found this solution to be slightly more direct with less code. This is the solution I opted to use. Note that this solution requires a separate Nuget from Moq itself - Moq.Contrib.HttpClient

Example:

[Fact]
public async Task UsingMoqContribHttpClient()
{
    //arrange
    const int personId = 1;
    var mockHandler = new Mock<HttpMessageHandler>(MockBehavior.Strict);
    var dto = new Person { Id = personId, Name = "Dave", Age = 42 };
    var mockUrl = $"https://myurl?id={personId}";
    var mockResponse = mockHandler.SetupRequest(HttpMethod.Get, mockUrl)
        .ReturnsJsonResponse<Person>(HttpStatusCode.OK, dto);

    // Inject the handler or client into your application code
    var httpClient = mockHandler.CreateClient();
    var sut = new ClassUnderTest(httpClient);

    //act
    var actual = await sut.GetPersonAsync(personId);

    //assert
    Assert.NotNull(actual);
    Assert.Equivalent(dto, actual);
    mockHandler.VerifyRequest(HttpMethod.Get, mockUrl, Times.Once());
}


WireMock.Net

A realtive newcomer to the game, WireMock.net is gaining popularity. This would be a reasonable solution instead of Microsoft.AspNetCore.TestHost if you are writing Integration Tests where calls to the endpoint are actually made instead of being mocked. I thought this would be my pick at first but decided against it for two reasons:

  1. it does actually open ports to facilitate the test. Since I've had to fix port-exhaustion issues from improper usage of HttpClient in the past, I decided to pass on this solution as I wasn't sure how well it would scale across a large codebase with many unit tests running in parallel.
  2. The urls used must be resolvable (actual legit urls). If you want the simplicity of not caring about a "real" url (just that the url you expected was actually called) then this may not be for you.

Example:

public class TestClass : IDisposable
{
    private WireMockServer _server;

    public TestClass()
    {
        _server = WireMockServer.Start();
    }

    public void Dispose()
    {
        _server.Stop();
    }

    [Fact]
    public async Task UsingWireMock()
    {
        //arrange
        const int personId = 1;
        var dto = new Person { Id = personId, Name = "Dave", Age = 42 };
        var mockUrl = $"https://myurl?id={personId}";

        _server.Given(
            Request.Create()
                .WithPath(mockUrl))
            .RespondWith(
                Response.Create()
                    .WithStatusCode(200)
                    .WithHeader("Content-Type", "application/json")
                    .WithBodyAsJson(dto));

        // Inject the handler or client into your application code
        var httpClient = _server.CreateClient();
        var sut = new ClassUnderTest(httpClient);

        //act
        var actual = await sut.GetPersonAsync(personId);

        //assert
        Assert.NotNull(actual);
        Assert.Equivalent(dto, actual);
    }
}
Share

January 14, 2025

.NET 9.0 Debugging Issue - F10 Step Over executes multiple steps

I recently ran into a debugging issue with my latest VisualStudio 2022 update and Resharper C# installation. It's important to note that I didn't start using this setup until I'd upgraded my projects to .NET 9.0.

I was able to hit breakpoints but found that while stepping over statements (F10), the debugger would sometimes run to the next breakpoint, execute a random number of steps forward to a different line in the call stack, or run to completion. The issue was intermittent too. Ugh. I also use a number of VisualStudio extensions so that didn't make it any easier to find the cause. I ended up trying the following to no avail:
  1. disabling Resharper's Async Typing and Debugger Integration. I'd seen some race conditions with the Async Typing and since the debugging issue was intermittent I figured I'd try disabling Async Typing even though it didn't have any apparent connection to the debugger. 
  2. disabling all extensions 
  3. uninstalling all extensions 
  4. repairing the VisualStudio installation
Once I was down to a bare bones VisualStudio installation I figured it was VisualStudio itself. By this time I didn't want to continue debugging by deduction any longer so I didn't want to go down the road of rolling back to previous VisualStudio versions. I went on to the Feedback Forum for VisualStudio to look for an existing bug and open one if I couldn't find one there. I came upon this issue in the Developer Forum: Debugger randomly stepping over user code. It never occurred to me that I was now using .NET 9 and the problem could've been related. ðŸ¤¯

I ultimately found the following issues opened for the .NET 9.0 runtime which all had the same root cause:
  • Debugging Issue VS 2022 .net 9 #110841
  • Step becomes a "go" in .NET 9 #109785
  • foreach will jump to other code in dotnet9 #109812
  • Step Over sometimes executes a lot more than one statement #109885
  • And the fix merged here: #110533
The fix was pretty small and there were only two files changed:

The Controller in the CoreClr's Debugger Execution Engine:

And the Thread Suspension class:


Ironically, as I was writing this post I got an email about .NET 9.0.1 being released. I couldn't find any of the issues or the PR for the fix included in the Release Notes. I went back to the Fix a step that becomes a go #110533 PR notes and saw that the Milestone for the fix is 9.0.2 (release date TBD). I was disappointed to find that the fix was not included in the .NET 9.0.1 Release but happy that it is coming in the next release of 9.0.2.


Share

January 12, 2025

What is LINQ to Xml Atomization?

Atomization is the process that the LINQ to Xml runtime uses to store and reuse string instances. Atomization means that if two XName objects have the same local name, and they're in the same namespace, they share the same instance. Likewise, if two XNamespace objects have the same namespace URI, they share the same instance. This optimizes memory usage and improves performance when comparing for equality of:
  • One XName instance to a different XName instance
  • One XNamespace instance to a different XNamespace instance
because the underlying intermediate language only has to compare references instead of string comparisons which would take longer. Being able to take advantage of this requires that both XName and XNamespace implement the equality and inequality operators - which of course they do. This concept is particularly relevant when working with XElement and XAttribute instances, where the same names might appear multiple times. XName and XNamespace also implement the Implicit Operator that converts strings to XName or XNamespace instances. This allows for automatically passing atomized instances as parameters to LINQ to Xml methods which then have better performance because of atomization. For example, this code implicitly passes an XName (with a value of "x") to the Descendants method:
var root = new XElement("root",
  new XElement("x", "1"),
  new XElement("y",
    new XElement("x", "1"),
    new XElement("x", "3")
  )
);

foreach (var e in root.Descendants("x").Where(e => e.Value == "1"))
{
  ...
}
Atomization is similar to string interning in .NET, where identical string literals are stored only once in memory. When LINQ to Xml processes XML data, it often encounters repeated element and attribute names. Instead of creating a new string object for each occurrence, it reuses existing string instances. It does this by caching the Name property in XName and XNamespace in an internal static XHashtable<WeakReference<XNamespace>>. You can find the source code here:

Practical Implications

So how does atomization affect my application?
  1. Element and Attribute Names: When you create elements or attributes using LINQ to Xml, the names are atomized. For example, if you create multiple elements with the same name, LINQ to Xml will store the name only once.
  2. Namespace Handling: Atomization also applies to XML namespaces. When you define namespaces in your XML, LINQ to XML ensures that each unique namespace URI is stored only once.
  3. Value Atomization: While element and attribute names are atomized, the values are not automatically atomized. However, if you're feeling adventurous and you frequently use the same values, you might consider implementing your own caching mechanism to achieve similar benefits. Now before you go off and write your own caching mechanism to cache values, consider that the .NET team has done a lot of work ensuring the caching of names is both thread-safe and performant. I've never found that I needed to do this though the largest xml documents I've had to work with are in the tens of MB's. If you're using much larger xml documents of hundreds of MB's or even 1 GB+ in size, then you may find this worthwhile.

Pre-Atomization

You might be thinking "..this is great, I can't do anything to improve performance here!". But there is. Unfortunately, even though you effectively can pass atomized instances to LINQ to Xml methods, there is a small cost. This is because the Implicit Operator has to be invoked. You can refer to the Atomization Benchmarks at the end of this post to get the details on some benchmarking I did. In a nutshell, the results show that pre-atomizing is just over 2x faster. That being said, we are talking about a couple hundred nanoseconds in the context of my test for an element with 3 child alements, each having an attribute and string content. The benefit of pre-atomization becomes much more evident with very large XML documents. Here is the xml used for test data in the benchmarks:
<aw:Root xmlns:aw="http://www.adventure-works.com">
  <aw:Data ID="1">4,100,000</aw:Data>
  <aw:Data ID="2">3,700,000</aw:Data>
  <aw:Data ID="3">1,150,000</aw:Data>
</aw:Root>
The full code for the benchmarks can be found at this gist: Linq to Xml - XName Atomization Benchmark.cs

Atomization and ReferenceEquals

Let's take a look at XName as an example. There are two ways to directly create XName instances:
  1. The XName.Get(String) or XName.Get(String, String) methods. See here
  2. The XNamespace.Addition(XNamespace, String) Operator method. See here
They are also created indirectly by LINQ to Xml when you create XDocument, XElement, and XAttribute instances. Here is some code to demonstrate that there is a single atomized instance referred to regardless of how the instance was created.
// Note that these are not explicitly declared as const
string x = "element";
string y = "element";
var stringsHaveSameReference = object.ReferenceEquals(x, y);
Console.WriteLine(
  $"string 'x' has same reference as string 'y' (expect true): {stringsHaveSameReference}");

// Create new XName instances (indirectly) thru XElement ctor
// using a string as the name
var xNameViaGet1 = XName.Get(localName, namespaceUri);
var xNameViaGet2 = XName.Get(localName, namespaceUri);

// Check if XName instances are the same
namesHaveSameReference = object.ReferenceEquals(xNameViaGet1, xNameViaGet2);
Console.WriteLine($"xNameViaGet1 is same reference as xNameViaGet2 (expect true): {namesHaveSameReference}");

// Create XName instances via XNamespace.Addition Operator
XNamespace ns = namespaceUri;
XName xNameViaNSAddition1 = ns + localName;
XName xNameViaNSAddition2 = ns + localName;

// Check if XName instances are the same
namesHaveSameReference = object.ReferenceEquals(xNameViaNSAddition1, xNameViaNSAddition2);
Console.WriteLine(
  $"xNameViaNSAddition1 is same reference as xNameViaNSAddition2 (expect true): {namesHaveSameReference}");

// Create XElement and XAttribute using XName instances
XElement ele = new XElement(xNameViaGet1, "value1");
XAttribute attr = new XAttribute(xNameViaGet2, "value2");

// Check if XName instances in XElement and XAttribute are the same
namesHaveSameReference = object.ReferenceEquals(ele.Name, attr.Name);
Console.WriteLine(
  $"ele.Name is same reference as attr.Name (expect true): {namesHaveSameReference}");

// Compare XName references that were created differently
namesHaveSameReference = object.ReferenceEquals(xNameViaGet1, xNameViaNSAddition1);
Console.WriteLine(
  $"xNameViaGet1 is same reference as xNameViaNSAddition1 (expect true): {namesHaveSameReference}");
namesHaveSameReference = object.ReferenceEquals(xNameViaGet1, ele.Name);
Console.WriteLine(
  $"xNameViaGet1 is same reference as ele.Name (expect true): {namesHaveSameReference}");

// Create 2 XElement instances with the same name of 'root' and same value
XElement eleViaCtor = new XElement("root", "value");
XElement eleViaParse = XElement.Parse("<root>value</root>");

// Note that the 2 XElements DO NOT have the same reference
bool xelementsHaveSameReference = object.ReferenceEquals(eleViaCtor, eleViaParse);
Console.WriteLine(
  $"eleViaCtor and eleViaParse refer to same instance: {xelementsHaveSameReference}");

// However, their respective XName properties DO have the same reference
namesHaveSameReference = object.ReferenceEquals(eleViaCtor.Name, eleViaParse.Name);
Console.WriteLine($"eleViaCtor.Name and eleViaParse.Name refer to same instance: {namesHaveSameReference}");

Atomization Benchmarks

These tests compared creating XElement and XAttribute instances by either passing a string or an XName instance to the constructors. Note that the memory allocations were identicial since they are all referring to the same XName instance.
Method                            | Mean     | Error   | StdDev  | Ratio | Gen0   | Allocated | Alloc Ratio |
----------------------------------|---------:|--------:|--------:|------:|-------:|----------:|------------:|
XNode_Construction_Passing_Strings| 355.9 ns | 3.69 ns | 3.45 ns |  1.00 | 0.0391 |     656 B |        1.00 |
XNode_Construction_Passing_XName  | 136.0 ns | 1.95 ns | 1.82 ns |  0.38 | 0.0391 |     656 B |        1.00 |
The full code for the benchmarks can be found at this gist: Linq to Xml - XName Atomization Benchmark.cs
Share

January 11, 2025

How to Control Namespace Prefixes with LINQ to Xml

LINQ to Xml is a great improvement over the XmlDocument DOM approach that uses types that are part of the System.Xml namespace. LINQ to Xml uses types that are part of the System.Xml.Linq namespace. In my experience, it shines for a large majority of the use cases for working with XML by offering a simpler method of accessing:
  • Elements (XElement)
  • Attributes (XAttribute)
  • Nodes (XNode)
  • Comments (XComment)
  • Text (XText)
  • declarations (XDeclaration)
  • Namespaces (XNamespace)
  • Processing Instructions (XProcessingInstruction)
However, this post isn't intended to be an intro to LINQ to Xml. You can read more about it here. The remaining use cases that need more complex and advanced XML processing are better handled by utilizing the XmlDocument DOM. This is because it has been around longer (since .NET Framework 1.1) whereas LINQ to Xml was added in .NET Framework 3.5. As a result the XmlDocument DOM is richer in features. I'd liken it to working with C++ instead of C# - you can do a lot more with it and it's been around a lot longer, but it is more cumbersome to use than C#. Now getting back to the matter at hand... When working with namespace prefixes using LINQ to Xml, it will handle the serialization of the prefixes for you. This is handled both by the XmlWriter as well as calling XDocument.ToString() or XElement.ToString(). This is helpful in most cases as it abstracts all of the details and just does it for you. It's not helpful when you need to control the prefixes that are serialized. Some examples of when you might need to control prefix serialization are:
  • comparing documents for semantic equivalence
  • normalizing an xml document
  • or canonicalizing an xml document

Even LINQ to Xml's XNode.DeepEquals() method doesn't consider elements or attributes with different prefixes across XElement or XDocument instances to be equivalent. How disappointing. 

Here is an example of how LINQ to Xml takes care of prefix serialization for you:
const string xml =  @"
<x:root xmlns:x='http://ns1' xmlns:y='http://ns2'>
    <child a='1' x:b='2' y:c='3'/>
</x:root>";

XElement original = XElement.Parse(xml);

// Output the XML
Console.WriteLine(original.ToString());
The output is:
<x:root xmlns:x="http://ns1" xmlns:y="http://ns2">
    <child a="1" x:b="2" y:c="3" />
</x:root>
Now create an XElement based on the original. This illustrates that the namespace prefixes specified in the original XElement are not maintained in the copy:
XElement copy =
  new XElement(original.Name,
    original.Elements()
      .Select(e => new XElement(e.Name, e.Attributes(), e.Elements(), e.Value)));

Console.WriteLine("\nNew XElement:");
Console.WriteLine(copy.ToString());
The output is:
New XElement:
<root xmlns="http://ns1">
  <child a="1" p2:b="2" p3:c="3" xmlns:p3="http://ns2" xmlns:p2="http://ns1" xmlns="" />
</root>

What happened to my prefixes of x and y? Where did the prefixes p2 and p3 come from? Also, note how there are some additional namespace declarations that aren't in the original XElement. We didn't touch anything related to namespaces when we created the copy; we just selected the elements and attributes from the original. You can't even use XNode.DeepEquals() to compare them for equivalence since the attributes are now different as well as the element names. I'll leave that as an exercise for the reader.

Controlling the prefixes yourself, although not very intuitive, is actually really easy. You might consider trying to change the Name property on the xmlns namespace declaration attribute to get the prefix rewritten. However, unlike the XElement.Name property which is writable, the XAttribute.Name property is readonly.

One caveat here: IF you happen to have superfluous (duplicate) namespace prefixes pointing to the same namespace, you are out of luck. I've written a lengthy description about this on Stack Overflow answering this question: c# linq xml how to use two prefixes for same namespace.

Would you believe me if I told you that LINQ is actually going to help you rewrite the prefixes? In fact, it doesn't just help you, it rewrites all of the prefixes for you! I bet you didn't see that coming! This is because modifications to the xml made at runtime cause LINQ to Xml to keep its tree updated so that it is in a consistent state. Imagine if you did made a programmatic change that caused the xml tree to be out of whack per se and the LINQ to Xml runtime didn't make updates for you to keep things in sync. Well, welcome to debugging hell.

So, all we have to do are a couple of really simple things and LINQ to Xml handles the rewriting for us. There are two approaches: you can either create a new element or modify the existing one. I've done some performance profiling and found that for larger documents above 1MB it is more efficient to create new elements and attributes rather than modifying existing ones. Some of this has to do with all of the allocations that are made when LINQ to Xml invokes the event handlers on the XObject class: see XObject Class. These are fired, thus allocating memory, regardless of whether you have event handlers wired to them or not. I'll show you both patterns so you can decide what works for you. The steps to rewrite vary depending on which approach you decide upon.

Let's use the following xml as an example with the assumption that we want to rewrite these prefixes for both namespaces that are declared and we want to rewrite prefix a to aNew and prefix b to bNew:
XNamespace origANamespace = "http://www.a.com";
XNamespace origBNamespace = "http://www.b.com";
const string originalAPrefix = "a";
const string originalBPrefix = "b";

const string xml = @"
<a:foo xmlns:a='http://www.a.com' xmlns:b='http://www.b.com'>
  <b:bar/>
  <b:bar/>
  <b:bar/>
  <a:bar b:att1='val'/>
</a:foo>
""";

Creating a new XElement

There are three steps.
Step 1: Create a new XNamespace and point it to the namespace whose prefix should be rewritten
// Define new namespaces
XNamespace newANamespace = origANamespace;
XNamespace newBNamespace = origBNamespace;
Step 2: Create new namespace declaration attributes that use the XNamespaces you created in Step 1
XAttribute newANamespaceXmlnsAttr =
  new XAttribute(XNamespace.Xmlns + "aNew", newANamespace);
XAttribute newBNamespaceXmlnsAttr =
  new XAttribute(XNamespace.Xmlns + "bNew", newBNamespace);
Step 3: Create a XElement that you will use this new namespace and contains all of the elements, attributes, and children of the original XElement
// Create a new XElement with the new namespace  
XElement newElement = 
  new XElement(newANamespace + originalElement.Name.LocalName,
    newANamespaceXmlnsAttr,
    newBNamespaceXmlnsAttr,
    originalElement
      .Elements()
      .Select(e => 
        new XElement(
          e.Name,
          e.Attributes(),
          e.Elements(),
          e.Value)));

Modifying an existing XElement

There are four steps with the last step being optional depending if you want to remove the old namespace prefix declaration. THe first two steps are identical to the creating a new XElement approach.
Step 1: Create a new XNamespace that has the new prefix you want and point it to the namespace whose prefix should be rewritten
// Define new namespaces
XNamespace newANamespace = origANamespace;
XNamespace newBNamespace = origBNamespace;
Step 2: Create new namespace declaration attributes that use the XNamespaces you created in Step 1
XAttribute newANamespaceXmlnsAttr =
  new XAttribute(XNamespace.Xmlns + "aNew", newANamespace);
XAttribute newBNamespaceXmlnsAttr =
  new XAttribute(XNamespace.Xmlns + "bNew", newBNamespace);
Step 3: Modify the original XElement by adding the new namespace declaration attributes
originalElement.Add(
  newANamespaceXmlnsAttr,
  newBNamespaceXmlnsAttr);
Step 4 (optional): Remove the original namespace declaration that has now been rewritten
// now remove the original 'a' and 'b' namespace declarations
originalElement
  .Attribute(XNamespace.Xmlns + originalAPrefix)?
  .Remove();
originalElement
  .Attribute(XNamespace.Xmlns + originalBPrefix)?
  .Remove();
I hope you found this helpful. Drop a comment and let me know.

Share

December 24, 2024

Memory Leaks - Part 2: Debugging Tools to Diagnose a Memory Leak

If you are reading this you may be in the unfortunate position of looking for an elusive and possibly intermittent problem in your production application. Debugging and diagnosing a memory leak or an OutOfMemoryException can be a daunting, intimidating and challenging task. Fortunately, there are a number of tools to help; some of these are "paid license" apps, but there are even more tools that are free. I'll discuss some .NET Debugging Tools available. I've used all of the following tools with the exception of SciTech .NET Memory Profiler. Each has its advantages and disadvantages. Personally, I prefer the free tools for several reasons:

  1. Getting approval for licensing and purchase of a 3rd-party tool is an uphill task and you rarely have time to wait for the approval process when it is a production issue.
  2. I find the feature set of a combination of the free tools gives you the largest "surface area" of features to help. Some are better at strict data collection, others have graphical views, some are static for post-mortem debugging, and others can do real-time analysis.
  3. Even though these are free, they are very robust and provide just as much data as the paid license tools. A good example of this is WinDbg which was developed in 1993 by Microsoft for in-house debugging of the Windows Kernel.

Free Tools

Advantages

  • Duh! It's free
  • There are lots of tools to choose from
  • All of the ones I've seen are from reputable and well-known companies.
  • You can often find blog posts (ahem...), articles, reddit threads, etc. that can provide some direction for getting started.

Disadvantages

  • Formal documentation can be lacking. Finding a blog post or article is great but comprehensive detail is often missing or at best glossed over. This can make getting started a bit more of a challenge if the tool is new to you.
  • Your company may have restrictions on using free tools for fear of malware, liability, or other reasons.

Licensed Tools

Hope this helps!


Share

May 14, 2019

Unifying .NET - One framework to rule them all?

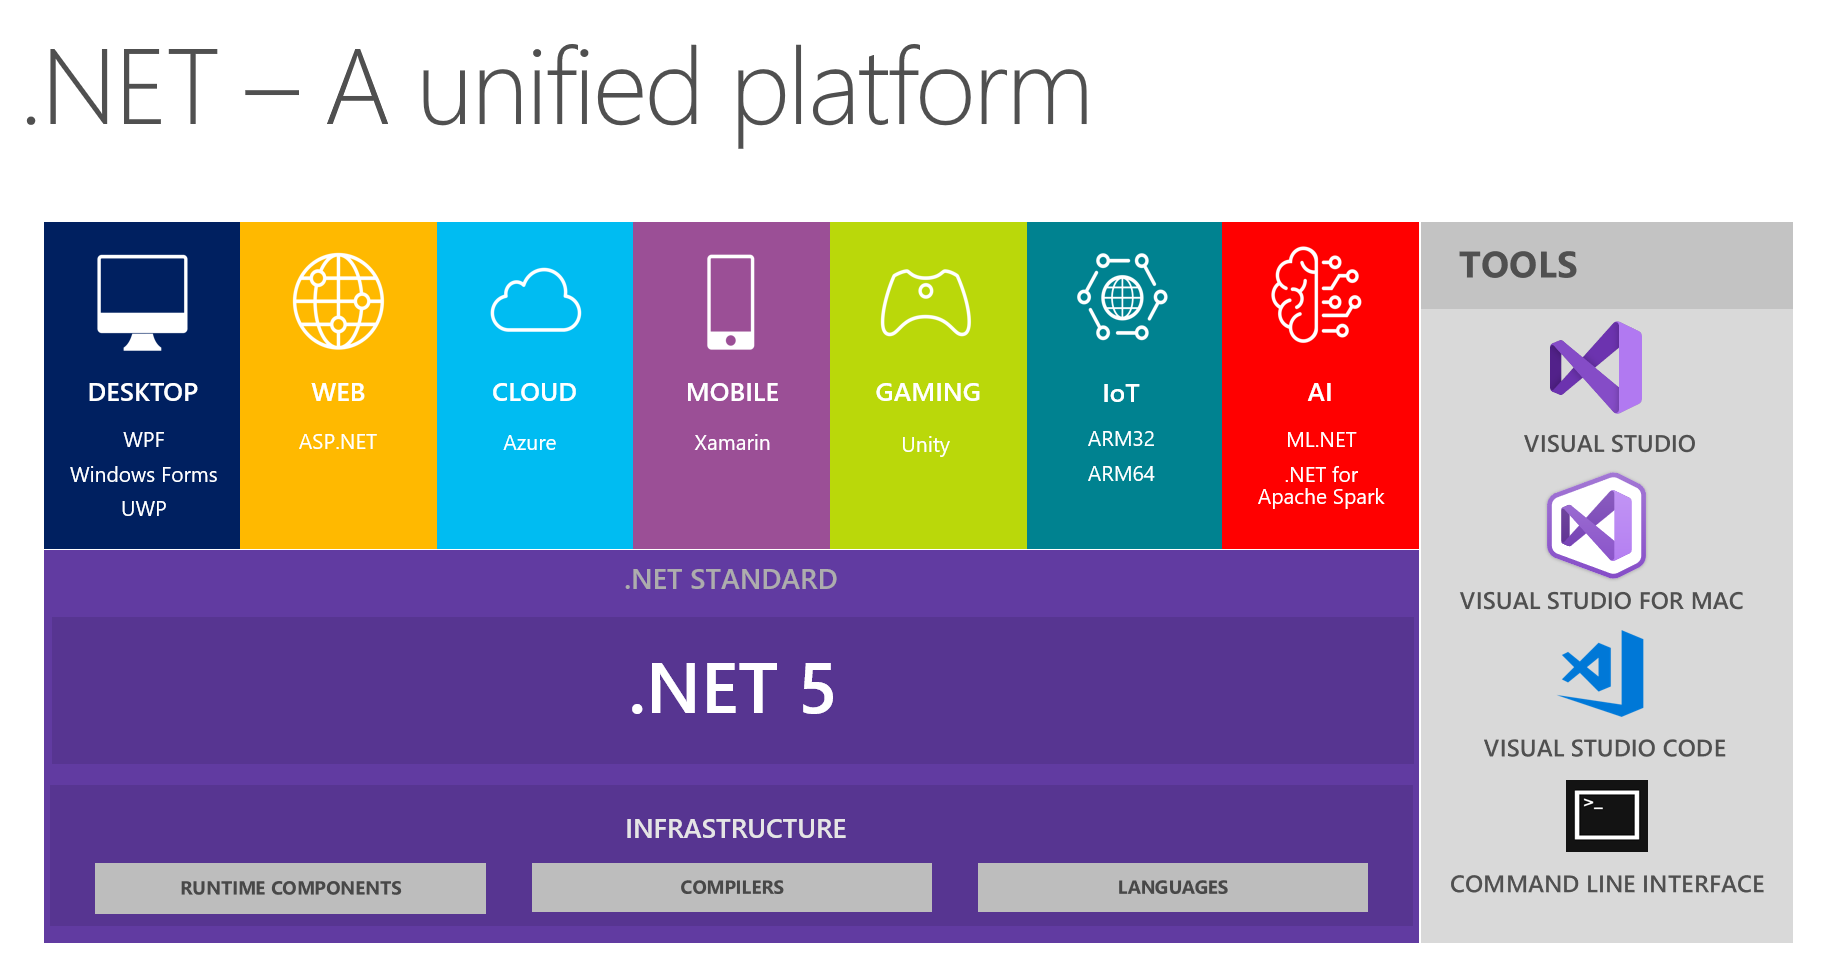
.NET 5 is on the way and scheduled to be delivered in November 2020. It is meant to unify .NET Framework, .NET Core, Mono (and possibly .NET Standard) - i.e. the entire .NET Platform.

After 17 years of working in .NET (since it was first released in 2002), I'm excited to see a unified solution to the splintered framework that .NET has become as of late.  IMO, .NET Framework, .NET Core, .NET Standard, and Mono have grown into a big bad monster that is growing faster than its parts can manage. While we know (and expect) technology to evolve and grow over time, we hope that it doesn't fragment and splinter so much that its parts become dissimilar.  I've seen it grow from a set of APIs that were questionable to something that is almost overwhelming - and certainly difficult to keep up with.  I'm pleased to see that Microsoft has acknowledged the splintering and has been working on a solution since at least December 2018.  I'm looking forward to seeing how much simpler things will become.


Now if they could just FINALLY fix "Edit and Continue"...........

(image is copyright of Microsoft)

Share

April 19, 2019

Missing Start Page from Visual Studio 2019

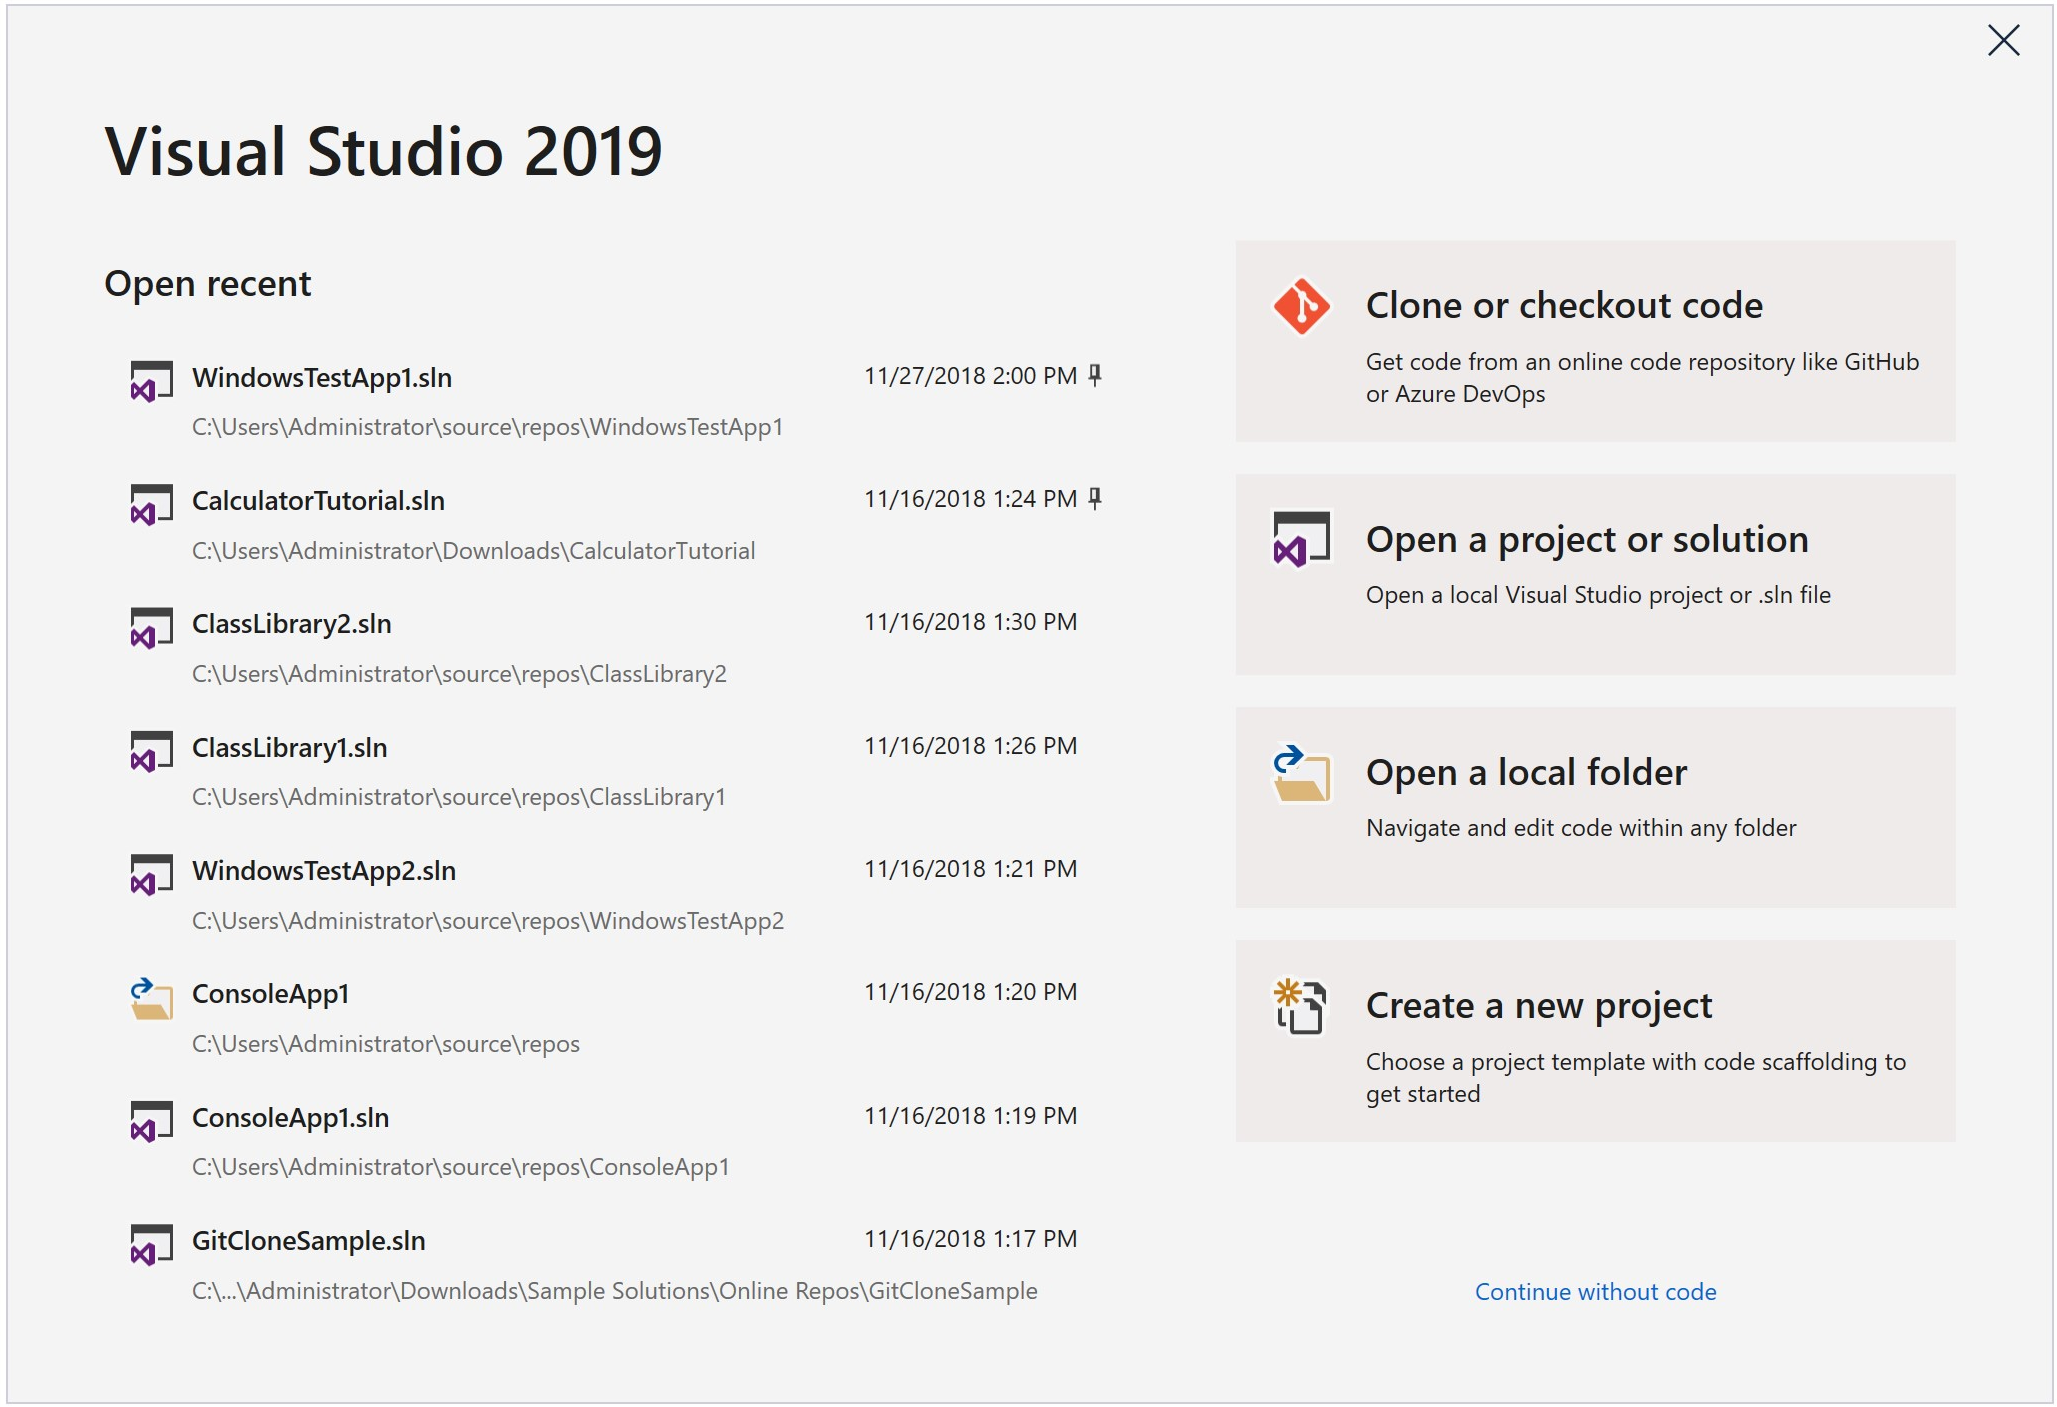
Oh Microsoft, why hast thou forsaken the beloved 'Start Page' and replaced it with a modal window?

The new 'Start Window' which replaces the 'Start Page'

You can see the design reasoning behind the new VS 2019 Start Window as posted at 'Get to code: How we designed the new Visual Studio start window' and 'New Start Window and New Project Dialog Experience in Visual Studio 2019'.

I sincerely appreciate any amount of thought, consideration, or testing that a company decides to invest in their products - especially a flagship produce like Visual Studio.  Based on the design reasoning Microsoft certainly had good intentions and did put a good amount of thought and testing into the effort.  However, I think they missed the mark.  Perform any Google search on "missing start page visual studio 2019" or look on the Developer Community Feedback Site and you'll see devs crying out for the beloved Start Page.

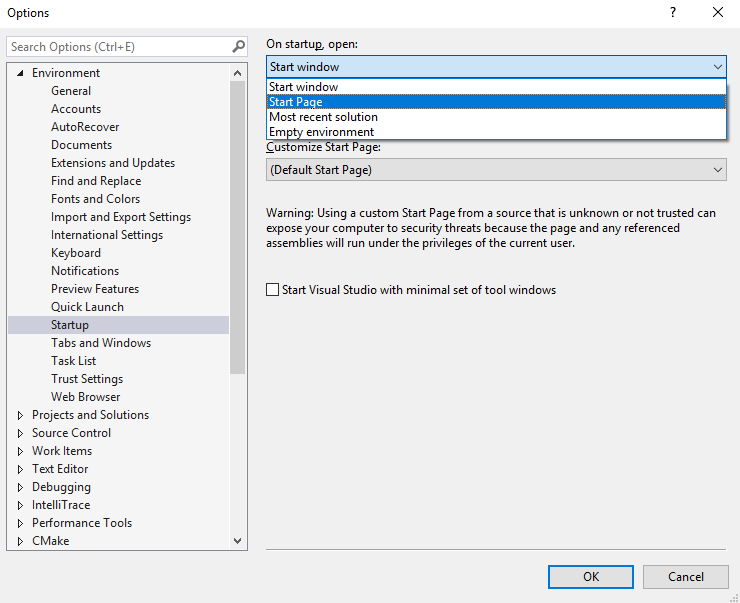
Some things are better left untouched and left alone and the Start Page is one of them. Some might argue the new 'Start Window' is a better experience but why make it a modal window?  Really?  In Visual Studio 2019 Preview 1, at least the option to restore the 'Start Page' was available as an option in the Startup settings:


However, somewhere along the way the 'Start Page' item has disappeared from the drop-down...headsmack!  Here's what the options are in version 16.0.2:


Ok, now I'm getting frustrated.  I get it. You're trying to funnel me into this new window that you think is better.  Well, my response is


Fortunately, Microsoft hasn't completely done away with the 'Start Page'...yet.  You can still add it by customizing the toolbar to add the Start Page button:

1. Right-click the toolbar and select 'Customize':

2. Select the 'Commands' tab:

3. Select 'Toolbar' and change the dropdown to whatever menu you'd like, then click the 'Add Command' button:
4. Choose 'File' from the Categories list box, then select 'Start Page' from the Commands list box:

So, there you go!  At least it's still there for now.  I'd bet any amount of money that they change the experience back so that either the 'Start Page' option is available from the Environment/Startup setting. To be fair, Microsoft has improved significantly at listening to community feedback.
Share

March 5, 2015

Angular2 and TypeScript

This is awesome for the Client side scripting world! I LOVE both of the languages and the features and safety of each.  Great collaboration!

Share

February 18, 2015

HTTP 2 is finally done

Finally the specs for HTTP 2 were finalized yesterday and will be integrated into Chrome 40 and a new FireFox coming over the next 10-12 weeks.  Here are some of the things to expect.

http://thenextweb.com/insider/2015/02/18/http2-first-major-update-http-sixteen-years-finalized/

https://www.mnot.net/blog/2014/01/30/http2_expectations

http://gizmodo.com/what-is-http-2-1686537168
Share

September 10, 2014

How not to do Dependency Injection

Dependency Injection (DI) is not a new concept and has been discussed, blogged, and published many times.  There are a huge number of books out there on the subject.  I've seen many usages and implementations of it used by various clients I've consulted for. 

Like the author of the blog post I refer to below, one of the most common and mis-used, abuses of, and antipatterns I've seen is the wrapping of the DI model in a static container.


I recently found an excellent article that explains in great detail why this is a bad idea and a big anti-pattern - http://www.devtrends.co.uk/blog/how-not-to-do-dependency-injection-the-static-or-singleton-container.

Hopefully, this will help improve your understanding of what DI is and how it should not be used.
Share

May 24, 2012

References to missing Types or Methods in referenced DLL

Ever wonder what happens if you have a binary reference to an external .dll and decide not to recompile the application or library that references/depends on it? You can get some strange errors depending on the changes that have been made. Ever experienced a BadImageFormatException, ExecutionEngineException, TypeLoadException, or MissingMethodException?

Firstly, the manifest file for the dependent app/library is not updated pointing to the new version. This can cause mismatched assembly version errors (BadImageFormatException).

Here are the results from some tests with the removal of types and/or methods on a referenced assembly (hereinafter referred to as ‘Bad Assembly’). All tests were done with x86 Console App/Library in separate solutions with a “static hardcoded” path reference to Bad Assembly (x64 shouldn’t matter):
  1. Results were always the same for Release/Debug builds.
  2. The bad assembly was always successfully loaded. ‘fuslogvw’ (.NET Assembly Load Viewer) confirmed this.
  3. Setting the reference to Bad Assembly as “Specific Version” (using v1.0.0.0) and changing the version on Bad Assembly to v1.1.0.0 had no effect. However, I didn’t try defining Bad Assembly in the “assemblies” section of the app.config. It is possible that would have given a different result.
  4. References to a missing Type OR calls to a missing Method from Bad Assembly in "static void Main()" resulted in a "System.ExecutionEngineException" (fatal error as shown below). This exception cannot be caught by any means: Assembly events, AppDomain events, try/catch block in "static void Main()". I confirmed this thru WinDbg. This is because it is the first method that the EE (CLR Execution Engine) tells the JIT to compile. Since JIT happens on a method-by-method basis and "static void Main()" is the entry point for the app, there is no place “upstream” where an exception can be caught. The error in the Event Viewer is completely cryptic and provides no indication what went wrong.
  5. If the reference to a missing Type OR calls to a missing Method from Bad Assembly occurred “downstream” of "static void Main()" AND there WAS NOT exception handling upstream, OR there WAS exception handling upstream but the exception was rethrown so that is was never caught again, then results were same as #4.  (i.e. unhandled exception)
  6. If the reference to a missing Type OR calls to a missing Method from Bad Assembly occurred “downstream” of "static void Main()" AND there WAS exception handling upstream, then the exception was caught as either a "System.TypeLoadException" or "System.MissingMethodException" respectively.  The exceptions were thrown from the JIT as the Type or Method was accessed.


HTH

Share

May 18, 2012

Why you should use ReadOnlyCollection<T>

Many people believe that you should be using List<T> to return collections from a public API. However, there are several reasons not to do so; instead return a ReadOnlyCollection<T>. The are several benefits of using a ReadOnlyCollection<T>:
  1. The *collection itself* cannot be modified - i.e. you cannot add, remove, or replace any item in the collection. So, it keeps the collection itself intact. Note that a ReadOnlyCollection<T> does not mean that the elements within the collection are "readonly"; they can still be modified. To protect the items in it, you’d probably have to have private “setters” on any properties for the reference object in the collection – which is generally recommended. However, items that are declared as [DataMember] must have both public getters and setters. So if you are in that case, you can’t do the private setter, but you can still use the ReadOnlyCollection<T>. Using this as a Design paradigm can prevent subtle bugs from popping up. One case that comes to mind is the case of a HashSet<T>. It is recommended to avoid having mutable properties on class or struct types that are going to be used in any collection that utilizes the types hash code to refer to an object of that type - e.g. HashSet<T>,
  2. Performance: The List<T> class is essentially a wrapper around a strongly-typed array. Since arrays are immutable (cannot be re-sized), any modifications made to a List<T> must create a complete copy of the List<T> and add the new item. Note that in the case of value types, a copy of the value type is created whereas, in the case of reference types, a copy of the reference to the object is created. The performance impact for reference types is negligible. The initial capacity for a List<T> is 4 unless specified thru the overloaded constructor - see here. https://learn.microsoft.com/en-us/dotnet/api/system.runtime.interopservices.collectionsmarshal.getvaluereforadddefault Obviously, this can be very bad for memory and performance. Don’t forget that not only the items directly within the List<T> itself are copied – but every value and object with the entire object graph for that reference type. This could easily contain other references types, collections, etc. This is why it is recommended to create/initialize a List<T> instance with the overloaded constructor which takes an int denoting the size of the List<T> to be created when possible. This can often be done since you are typically iterating on a "known" size value at runtime. For example, creating a List<T> of objects from a "Repository or DataService" method may iterate/read from a IDataReader object which has a property of RecordsAffected. If you are going to be putting an item in the List<T> based on the number of times the IDataReader is read: e.g. while(reader.Read()) you can easily create the list like so:
if (reader != null && reader.RecordsAffected > 0)
{
    // initialize the list with a pre-defined size
    List<Foo> someList = new List<Foo>(reader.RecordsAffected);
    while (reader.Read())
    {
         someList.Add(...);
         ...
    }
}

Just as a side note, every time that a List<T> needs to grow in size (its new size would exceed its current Capactity, the size is *doubled*. So, if you happen to add just one more item to a List<T> that wasn’t constructed with a pre-determined size, and the List<T> expands to accommodate the new item, there will be a whole lot of unused space at the end of the List<T> even though there aren’t any items in it – bad for memory and performance.
Share

May 17, 2012

Don't implement GetHashCode() on mutable fields/properties

CodeProject You shouldn't ever implement GetHashCode on mutable properties (properties that could be changed by someone) - i.e. non-private setters.   I've seen this done in several places and it results in very difficult to find bugs.

Here's why - imagine this scenario:
  1. You put an instance of your object in a collection which uses GetHashCode() "under the covers" or directly (Hashtable).
  2. Then someone changes the value of the field/property that you've used in your GetHashCode() implementation.
Guess what...your object is permanently lost in the collection since the collection uses GetHashCode() to find it! You've effectively changed the hashcode value from what was originally placed in the collection. Probably not what you wanted.
Share

April 17, 2012

How to determine which garbage collector is running

CodeProjectYou can determine which version of GC you're running via 2 methods:
  1. calling the System.Runtime.GCSettings.IsServerGC property
  2. attaching to the process using WinDbg and checking how many GC threads you have using the command "!sos.threads" without the quotes and (according to the below criteria)...
If you are running a Console app, WinForm app or a Windows Service, you will get the Workstation GC. Just because you are running on a Server OS doesn't mean that you will get the Server version of GC.
  • If your app is non-hosted on a multi-proc machine, you will get the Workstation GC - Concurrent by default.
  • If your app is hosted on a multi-proc machine, you will get the ServerGC by default.
The following apply to any given .NET Managed Process:

Workstation GC

  • Uni-processor machine
  • Always suspends threads
  • 1 Ephemeral GC Heap (SOH), 1 LOH GC Heap
  • Runs on thread that triggered GC
  • Thread priority is the same as the thread that triggered GC

Workstation GC - Concurrent

  • Only runs concurrent in Gen2/LOH (full collection)
  • Mutually exclusive with Server Mode
  • Slightly larger working set
  • GC Thread expires if not in use after a while
  • 1 Ephemeral GC Heap (SOH), 1 LOH GC Heap
  • Has a dedicated GC Thread
  • Thread priority is Normal

Server GC

  • Larger segment sizes
  • Faster than Workstation GC
  • Always suspends threads
  • 1 Ephemeral GC Heap (SOH) for each logical processor (this includes hyperthreaded), 1 LOH GC Heap for each logical processor (this includes hyperthreaded)
  • Has dedicated GC Threads
  • Thread priority is THREAD_PRIORITY_HIGHEST
There is only 1 Finalizer thread per managed process regardless of GC Mode. Even during a concurrent GC, managed threads are suspended (blocked) twice to do some phases of the GC.

A seldom known fact is that even if you try to set the Server mode of GC, you might not be running in Server GC; the GC ultimately determines which mode will be optimal for your app and WILL override your settings if it determines your ServerGC setting will negatively impact your application. Also, any hosted CLR app will have any manual GC settings overridden.

In CLR 4.0, things change just a little bit

  • Concurrent GC is now Background GC
  • Background GC only applies to Workstation GC
  • Old (Concurrent GC):
    • During a Full GC Allowed allocations up to end of ephemeral segment size
    • Otherwise, suspends all other threads
  • New (Background GC):
    • Allows for ephemeral GC’s simultaneously with Background GC if necessary
    • Performance is much faster
  • Server GC always blocks threads for collection of any generation

In CLR 4.5, things change just a little bit...again

  • Background Server GC
    • Server GC no longer blocks. Instead, it uses dedicated background GC threads that can run concurrently with user code - see MSDN: Background Server GC
Thus, in .NET 4.5+, all applications now have background GC available to them, regardless of which GC they use.

.NET 4.7.1 GC Improvements

.NET Framework 4.7.1 brings in changes in Garbage Collection (GC) to improve the allocation performance, especially for Large Object Heap (LOH) allocations. This is due to an architectural change to split the heap’s allocation lock into 2, for Small Object Heap (SOH) and LOH. Applications that make a lot of LOH allocations, should see a reduction in allocation lock contention, and see better performance. These improvements allow LOH allocations while Background GC (BGC) is sweeping SOH. Usually the LOH allocator waits for the whole duration of the BGC sweep process before it can satisfy requests to allocate memory. This can hinder performance. You can observe this problem in PerfView’s GCStats where there is an ‘LOH allocation pause (due to background GC) > 200 msec Events’ table. The pause reason is ‘Waiting for BGC to thread free lists’. This feature should help mitigate this problem.
Share

March 13, 2012

Don't use 'using()' with a WCF proxy


If you're trying to be a conscientious developer and making sure that you cleanup your resources - great! You are writing 'using()' blocks around all of your disposable items - great...except when the disposable item is a WCF Client/Proxy! The using() statement and the try/finally effectively have the same IL:

    // The IL for this block is effectively the same as
    // the IL for the second block below
    using (var win = new Form())
    {
    }

   
    // This is the second block
    Form f = null;
    try
    {
        f = new Form();
    }
    finally
    {
        if (f != null)
        {
            f.Dispose();
        }
    }

Here's the IL for the 'using()' block above compiled in Release mode:

     IL_0000:  newobj     instance void [System.Windows.Forms]System.Windows.Forms.Form::.ctor()
     IL_0005:  stloc.0
     .try
     {
         IL_0006:  leave.s    IL_0012
     }  // end .try
     finally
     {
         IL_0008:  ldloc.0
         IL_0009:  brfalse.s  IL_0011
         IL_000b:  ldloc.0
         IL_000c:  callvirt   instance void [mscorlib]System.IDisposable::Dispose()
         IL_0011:  endfinally
     }  // end handler


Here's the IL for the second block (try/finally) compiled in Release mode:

     IL_0012:  ldnull
     IL_0013:  stloc.1
     .try
     {
         IL_0014:  newobj     instance void [System.Windows.Forms]System.Windows.Forms.Form::.ctor()
         IL_0019:  stloc.1
         IL_001a:  leave.s    IL_0026
     }  // end .try
     finally
     {
         IL_001c:  ldloc.1
         IL_001d:  brfalse.s  IL_0025
         IL_001f:  ldloc.1
         IL_0020:  callvirt   instance void [System]System.ComponentModel.Component::Dispose()
         IL_0025:  endfinally
     }  // end handler

As you can see, the IL is nearly identical.

Well this is all fine and good but let's get back to the issue with WCF.  The problem is that if an exception is thrown during disposal of the WCF client/proxy, the channel is never closed.  Now, in general, any exception that occurs during disposal of an object is indeed undesirable.  But, in the case of WCF, multiple channels remaining open could easily cause your entire service to fall on its face - not to mention what might eventually happen to your web server.

Here is an alternative solution that can be used:

    WCFProxy variableName = null;
    try
    {
        variableName = new WCFProxy();

        // TODO code here

        variableName.Close();
    }
// if you need to catch other exceptions, do so here...
    catch (Exception)
    {
        if (variableName != null)
        {
            variableName.Abort();
        }
        throw;
    }

MSDN does have a brief on this issue which you can read here - http://msdn.microsoft.com/en-us/library/aa355056.aspx

Share

January 26, 2012

Why you should comment your code...

Here are the most important reasons for including comments/documentation when writing code:
  1. I absolutely believe in documenting code using both XML doc comments on methods as well as unlined comments when/where necessary. This facilitates docentation files being generated automatically and can be used to create .chm files. For all of us who are lazy or those that think it takes too much time, use GhostDoc. Thus, laziness is no excuse.
  2. What if you have to maintain code that was written without comments? Do you want to waste your time digging thru code? What if it's more than just a method or class? What if its a library or framework? I personally have better things to do with my time.
  3. What about someone new to your team? What if your the new guy? Is it easier to learn it with or without documentation/comments?
  4. If you are writing a framework, library or API that will be used by other teams/API consumers, how are they supposed to know what it does without documentation? Do you expect them to dig thru your code to figure it out? What if they don't have access to the code? Would you want to have to do this?
  5. What if you find some code without comments and the code looks wrong or inefficient? It's certainly possible that it was written that way for a reason. Only comments would help.
  6. In addition to adding comments, code itself should be self documenting: use descriptive class, member, variable, parameter and method names.
When you write code, remember that you're not always going to be the one modifying, supporting it or consuming it...

Peter Ritchie has a good post about what comments are NOT for - a pretty good read: http://msmvps.com/blogs/peterritchie/archive/2012/01/30/what-code-comments-are-not-for.aspx


Share

December 8, 2011

How to Tell if an Assembly is Debug or Release

The DebuggableAttribute is present if you compile in any setting for 'Debug' mode and when Release mode is selected and Debug Info set to anything other than "none". So, just looking for the presence of DebuggableAttribute is not sufficient and could be misleading. So, you could still have an assembly that is JIT optimized where the DebuggableAttribute is present in the Assembly Manifest.

First, you need to define exactly what is meant by "Debug" vs. "Release"...
  • Do you mean that the app is configured with code optimization?
  • Do you mean that you can attach the VS/JIT Debugger to it?
  • Do you mean that it generates DebugOutput?
  • Do you mean that it defines the DEBUG constant?  Remember that you can conditionally compile Methods with the System.Diagnostics.Conditional() attribute.
IMHO, when someone asks whether or not an assembly is "Debug" or "Release", they really mean if the code is optimized...

Sooo, do you want to do this manually or programmatically?

Manually:
You need to view the value of the DebuggableAttribute bitmask for the assembly's metadata.  Here's how to do it:

  1. Open the assembly in ILDASM
  2. Open the Manifest
  3. Look at the DebuggableAttribute bitmask.  If the DebuggableAttribute is not present, it is definitely an Optimized assembly.
  4. If it is present, look at the 4th byte - if it is a '0' it is JIT Optimized - anything else, it is not:
// Metadata version: v4.0.30319
....
     //  .custom instance void [mscorlib]System.Diagnostics.DebuggableAttribute::.ctor(valuetype [mscorlib]System.Diagnostics.DebuggableAttribute/DebuggingModes) = ( 01 00 02 00 00 00 00 00 )

    Programmatically: assuming that you want to know programmatically if the code is JITOptimized, here is the correct implementation:

    void Main()
    {
    	var HasDebuggableAttribute = false;
    	var IsJITOptimized = false;
    	var IsJITTrackingEnabled = false;
    	var BuildType = "";
    	var DebugOutput = "";
    	var ReflectedAssembly = Assembly.LoadFile(@"C:\src\TMDE\Git\RedisScalingTest\bin\Release\netcoreapp3.1\RedisScalingTest.dll");
     
    	//	var ReflectedAssembly = Assembly.LoadFile(@"path to the dll you are testing");
    	object[] attribs = ReflectedAssembly.GetCustomAttributes(typeof(DebuggableAttribute), false);
     
    	// If the 'DebuggableAttribute' is not found then it is definitely an OPTIMIZED build
    	if (attribs.Length > 0)
    	{
    		// Just because the 'DebuggableAttribute' is found doesn't necessarily mean
    		// it's a DEBUG build; we have to check the JIT Optimization flag
    		// i.e. it could have the "generate PDB" checked but have JIT Optimization enabled
    		DebuggableAttribute debuggableAttribute = attribs[0] as DebuggableAttribute;
    		if (debuggableAttribute != null)
    		{
    			HasDebuggableAttribute = true;
    			IsJITOptimized = !debuggableAttribute.IsJITOptimizerDisabled;
     
    			// IsJITTrackingEnabled - Gets a value that indicates whether the runtime will track information during code generation for the debugger.
    			IsJITTrackingEnabled = debuggableAttribute.IsJITTrackingEnabled;
    			BuildType = debuggableAttribute.IsJITOptimizerDisabled ? "Debug" : "Release";
     
    			// check for Debug Output "full" or "pdb-only"
    			DebugOutput = (debuggableAttribute.DebuggingFlags &
    							DebuggableAttribute.DebuggingModes.Default) !=
    							DebuggableAttribute.DebuggingModes.None
    							? "Full" : "pdb-only";
    		}
    	}
    	else
    	{
    		IsJITOptimized = true;
    		BuildType = "Release";
    	}
     
    	Console.WriteLine($"{nameof(HasDebuggableAttribute)}{HasDebuggableAttribute}");
    	Console.WriteLine($"{nameof(IsJITOptimized)}{IsJITOptimized}");
    	Console.WriteLine($"{nameof(IsJITTrackingEnabled)}{IsJITTrackingEnabled}");
    	Console.WriteLine($"{nameof(BuildType)}{BuildType}");
    	Console.WriteLine($"{nameof(DebugOutput)}{DebugOutput}");
    }


    Share